Predictive Vegetation Maps
Predictive vegetation maps serve as decision-making tools and provide critical information for many landscape planning and management activities. Vegetation boundaries traditionally used to create maps can be produced in a number of different ways by digitizing vegetation boundaries, classifying remotely sensed images, or by developing predictive models.
Predictive vegetation modeling can be defined as predicting the geographic distribution of vegetation composition across a landscape from mapped environmental variables. It is founded in ecological niche theory and vegetation gradient analysis, and maps environmental variables as they correspond to environmental gradients.
Predictive geographical modeling can also be understood as the quantification of species-environment relationships done in conjunction with GIS.
Regardless of the definition, predictive vegetation modeling has enabled vegetation mapping to evolve from traditional vegetation boundary drawings to remote sensing image classification and spatial modeling of species and vegetation distribution, vegetation structure, and vegetation characteristics across different spatial and temporal scales.
We use predictive vegetation modeling to model historical, present, and future vegetation and species distribution. We also use it to model and map ecological goods and services such as carbon biomass and other vegetation characteristics, including floristic quality, vertical structure, and vegetation quality and health.
Predictive modelling may utilize different models and combinations of variables. Statistical modeling techniques can be used to model and predict the distribution of vegetation across a landscape.
Modeled Historical Vegetation
Modeled Present Day Vegetation
- Regional Municipality of York (Puric-Mladenovic, D. 2003)
- Digital atlas of predicted species distributions, vegetation assemblages and habitat characteristics for the eco-district 6e10 and GPE – St. Lawrence Islands National Park, version 1.0 (Puric-Mladenovic, D., Buck, J., David Bradley, Arends, R., and Strobl, S. 2008)
Biomass and Carbon Predictive Modeling and Mapping
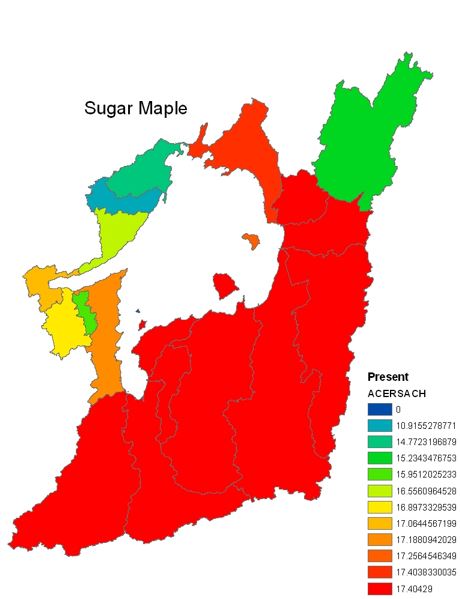
Species Distribution and Predictive Modeling
- Probability of Habitat Suitability for Dwarf Lake Iris
- Probability of Habitat Suitability for Hill's Thistle
- Predicted abundance of sugar maple for the eco-district 6e10 and GPE - St. Lawrence Islands National Park (Puric-Mladenovic, D., Buck, J., Bradley, D., Arends, R., Strobl, S. 2008)
Modeled Invasive Species Distribution
Modeled Species Distribution Under Future Climates
Applications of Predictive Vegetation Maps
Predictive vegetation maps have applications ranging from forest restoration, conservation, and management to land use planning. Some applications include the design of green systems and landscape planning, informing restoration, protection and recovery of species at risk and their habitats, and supporting conservation efforts and natural resource management.
In settled landscapes, detailed vegetation maps are used to support diverse management, planning, and conservation needs. This can include forestry and silviculture, fire management, pest and invasive species management, park management, recreation, wildlife habitat modeling, natural heritage systems planning, municipal land use planning, education, research, Species at Risk recovery planning, and climate change mitigation and adaptation.
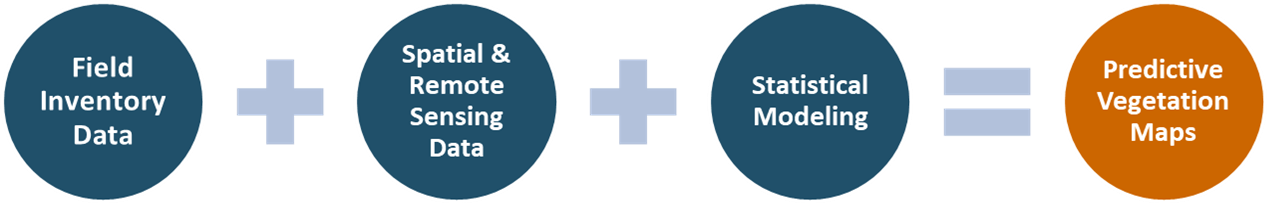
A methodology has been developed that leverages and combines strategic field campaigns using VSP, existing spatial and environmental data, and statistical modeling. This methodology is designed to be carried out in partnership with organizations that can provide the expertise and support to conduct field work.
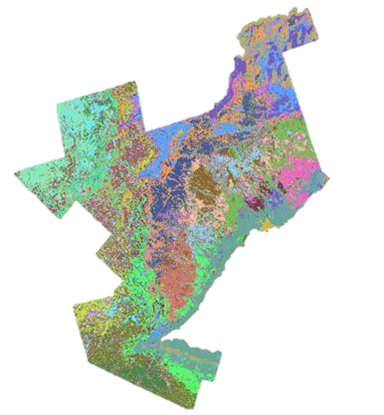
Using VSP field data along with environmental and spectral remote sensing data, it was possible to statistically model over 180 vegetation maps for Ecodistrict 6E-10. The series of maps developed included detailed information about individual plant species, forest conditions such as canopy closure and basal area, and types of forest and wetland vegetation communities.
Digital atlas of predicted species distributions, vegetation assemblages and habitat characteristics for the eco-district 6e10 and GPE – St. Lawrence Islands National Park, version 1.0 (Puric-Mladenovic, D., Buck, J., David Bradley, Arends, R., and Strobl, S. 2008)
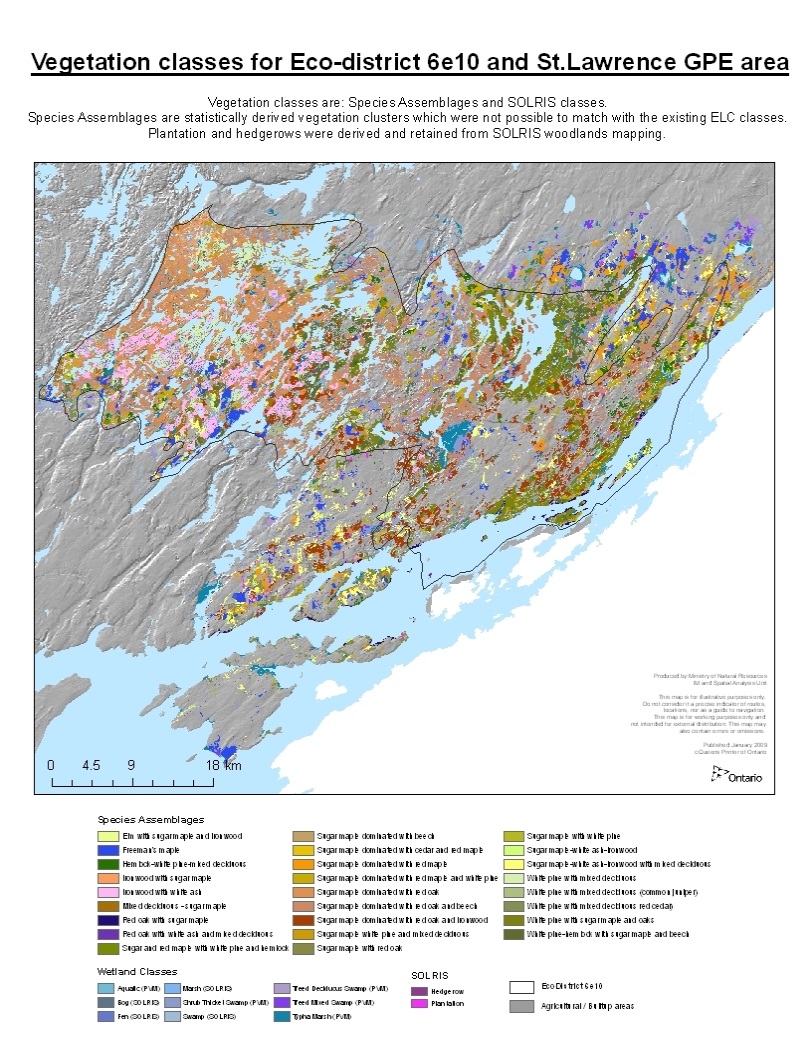
Vegetation classes for Ecodistrict 6e10 and St. Lawrence GPE area. OMNR 2009.
Click on thumbnail for enlarged map.